Appearance
Your first flow
In ten minutes you build a flow that checks for new orders every five seconds. You place two components, write a few lines of C#, run the flow and watch it work. You need a designer that is connected to an environment.
1. Create the flow
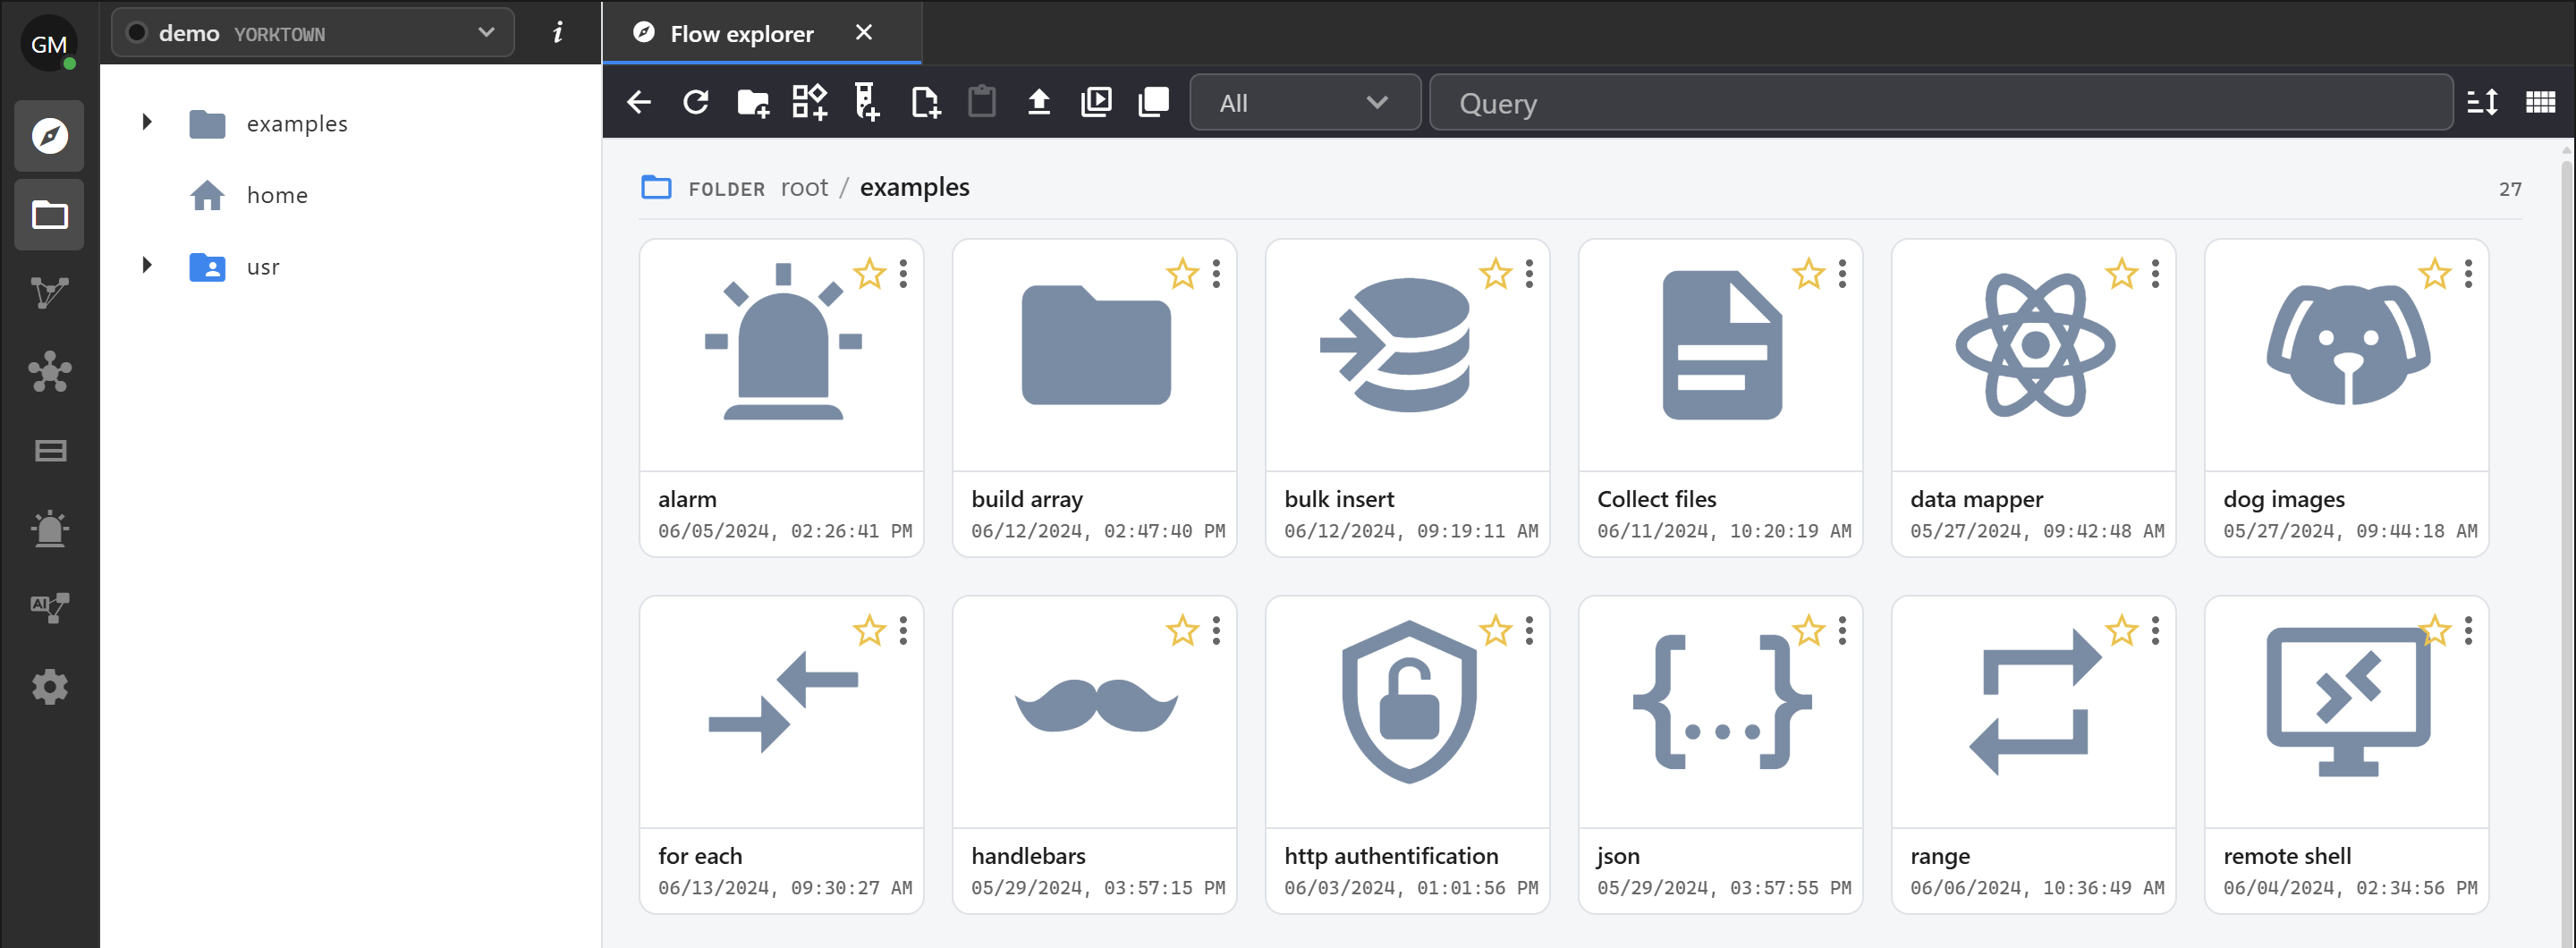
Open the Flow explorer from the left rail and go to the folder for your flow. Click New logical flow in the toolbar. The flow opens in a new tab.
Click an empty part of the canvas and change Name in the flow properties to Order intake.
2. Add a Timer
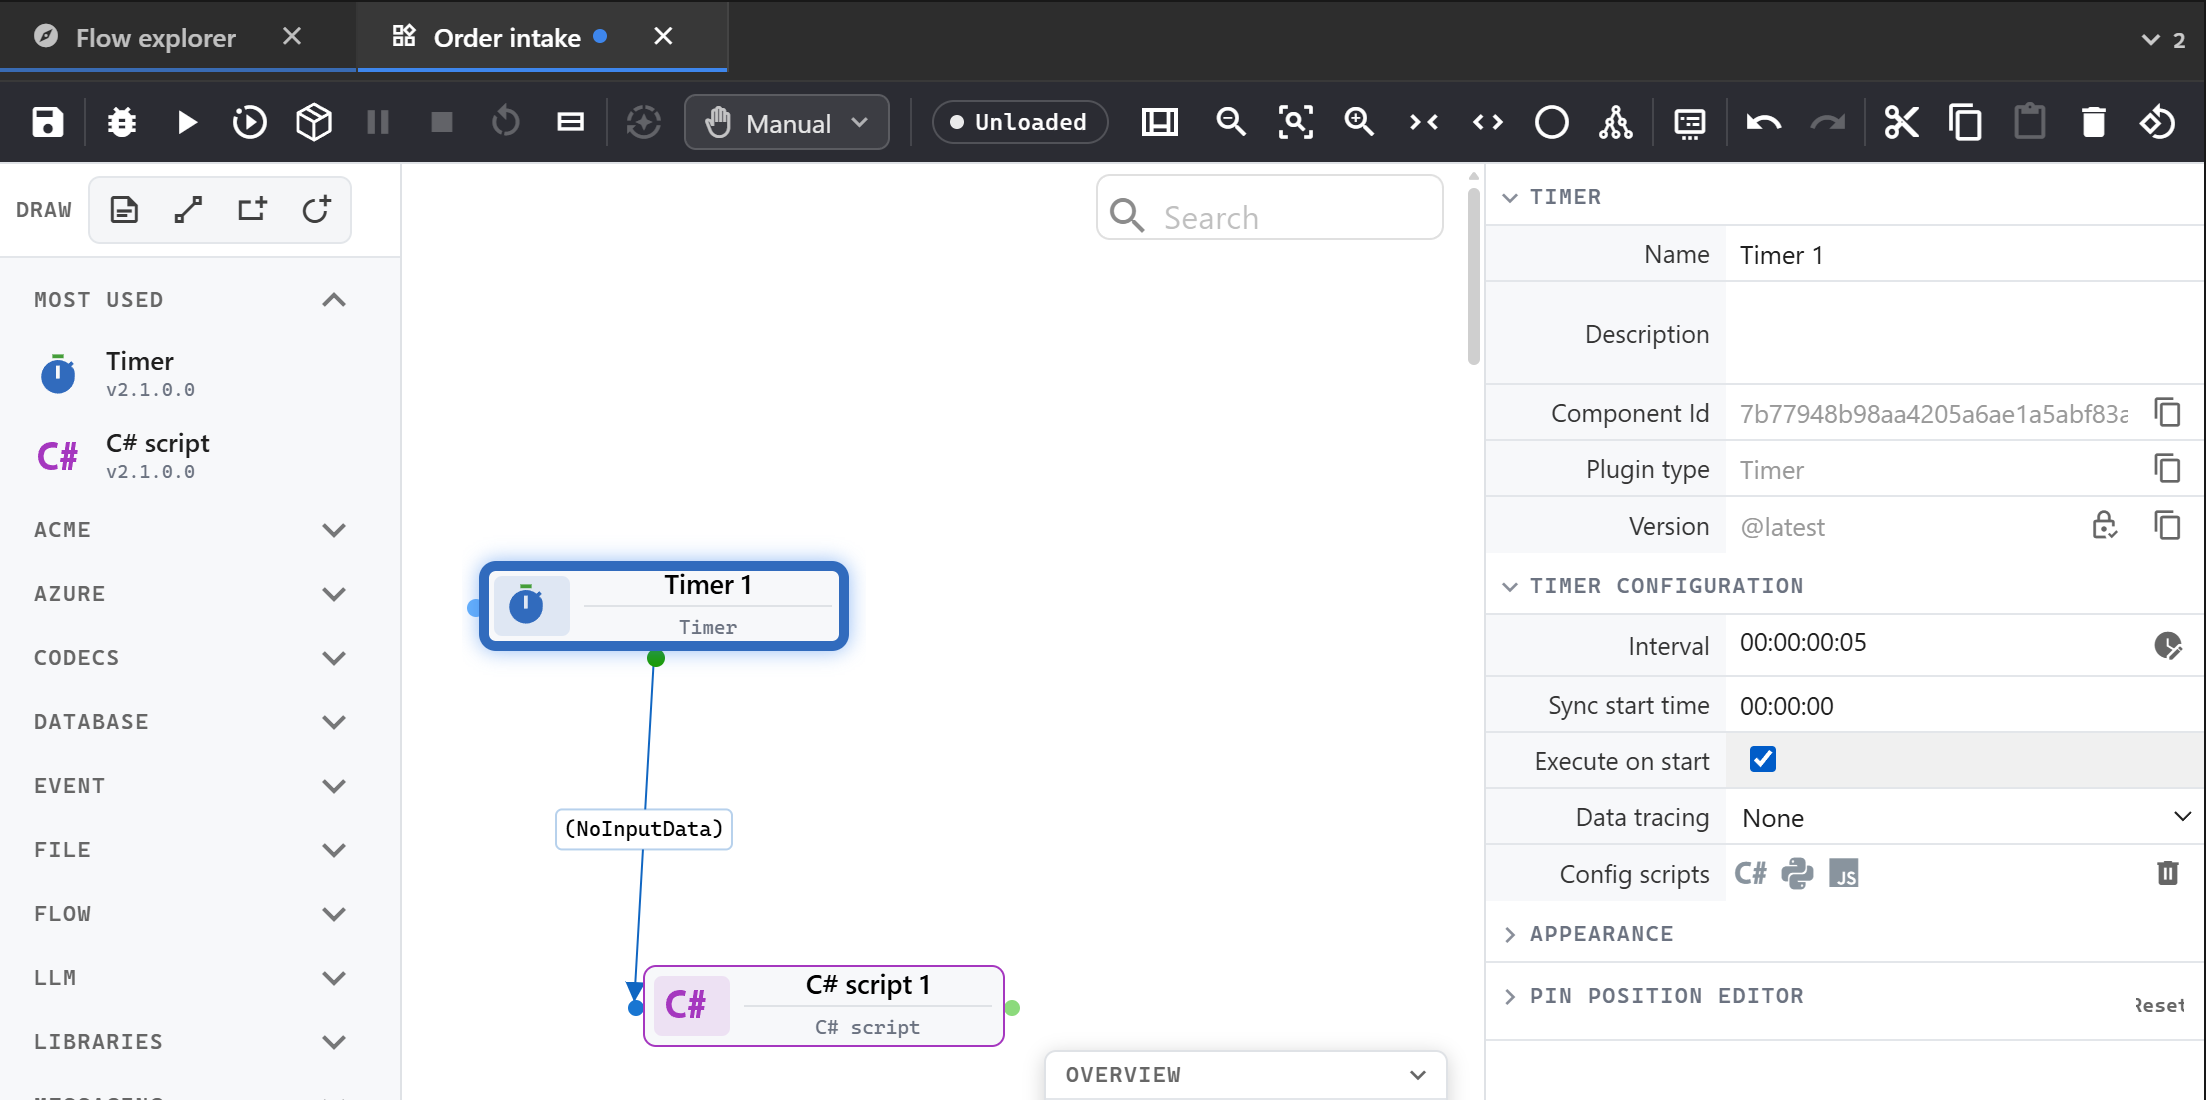
Type timer in the search box at the bottom of the toolbox and drag Timer onto the canvas.
Select the Timer. Its properties show Interval: click the edit button next to it, set Seconds to 5 and the other fields to 0, and Save. Tick Execute on start so the first run happens as soon as the flow starts.
3. Add a C# script
Press on the Timer's output pin and drag to an empty spot below it. The Plugins menu opens: type C# script and pick it. The script is placed there and connected to the Timer.
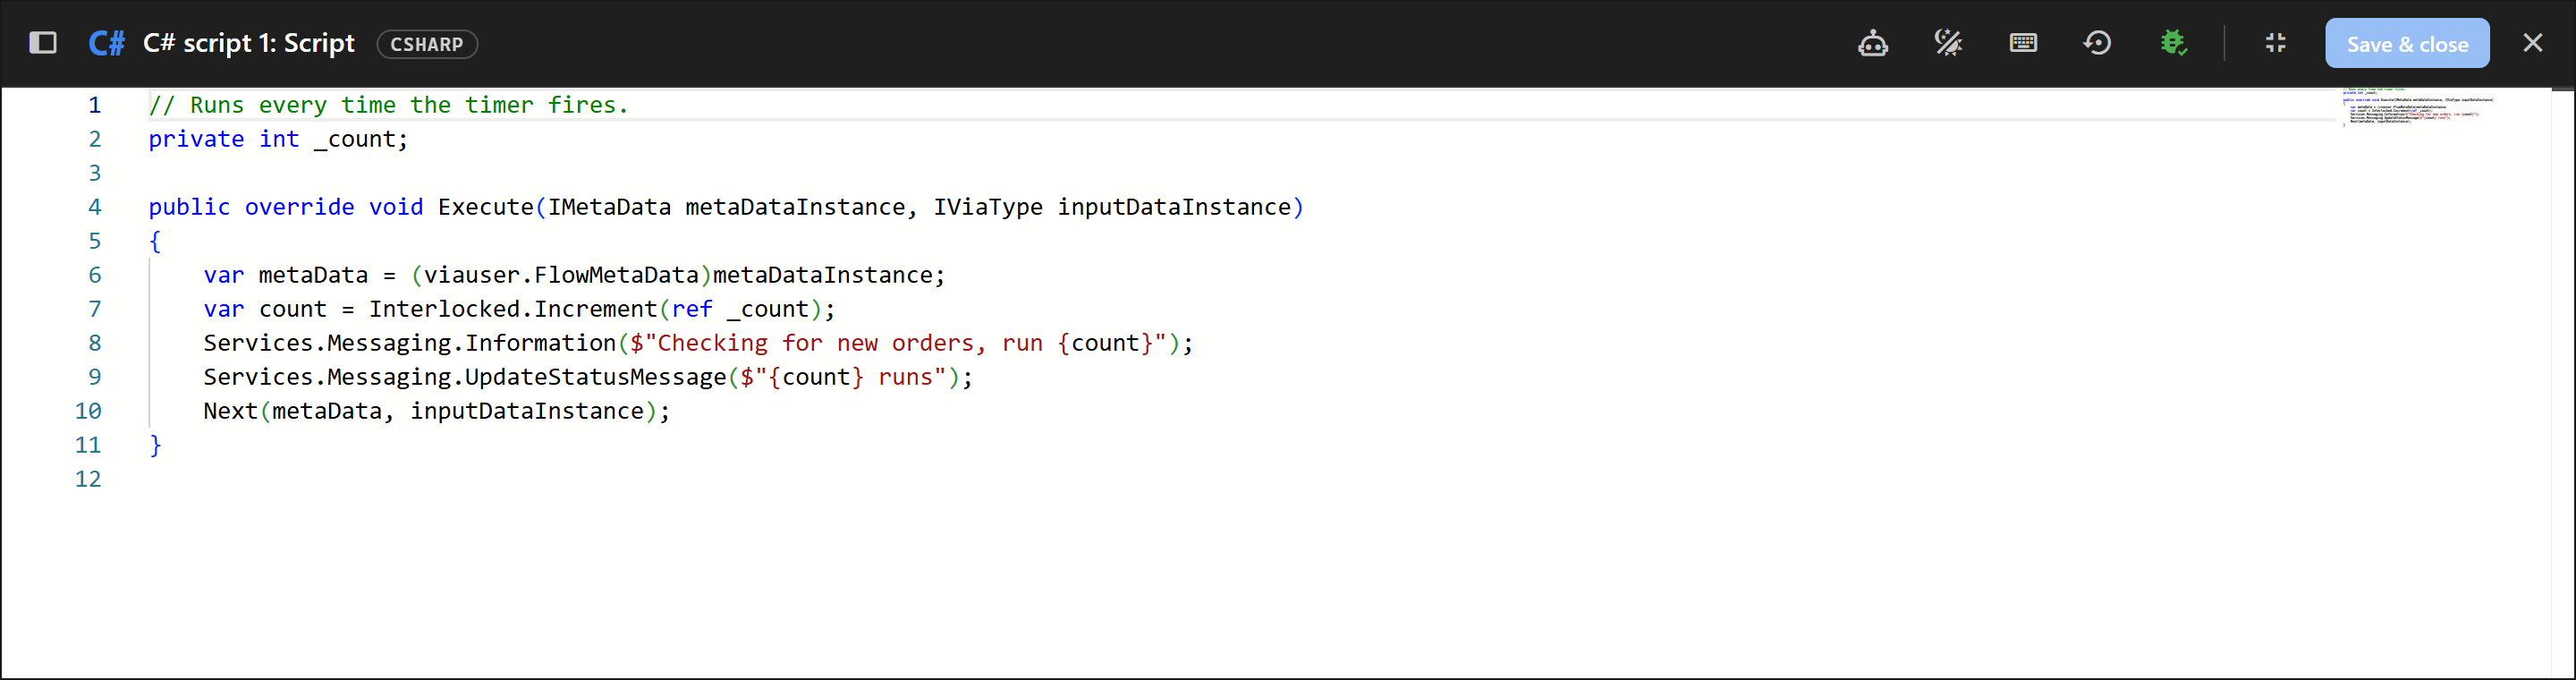
Select the script and click the pencil next to Script to open the editor. Replace the template with:
csharp
// Runs every time the timer fires.
private int _count;

public override void Execute(IMetaData metaDataInstance, IViaType inputDataInstance)
{
    var metaData = (viauser.FlowMetaData)metaDataInstance;
    var count = Interlocked.Increment(ref _count);
    Services.Messaging.Information($"Checking for new orders, run {count}");
    Services.Messaging.UpdateStatusMessage($"{count} runs");
    Next(metaData, inputDataInstance);
}
Click Save & close, then press Ctrl+S to save the flow.
4. Run it
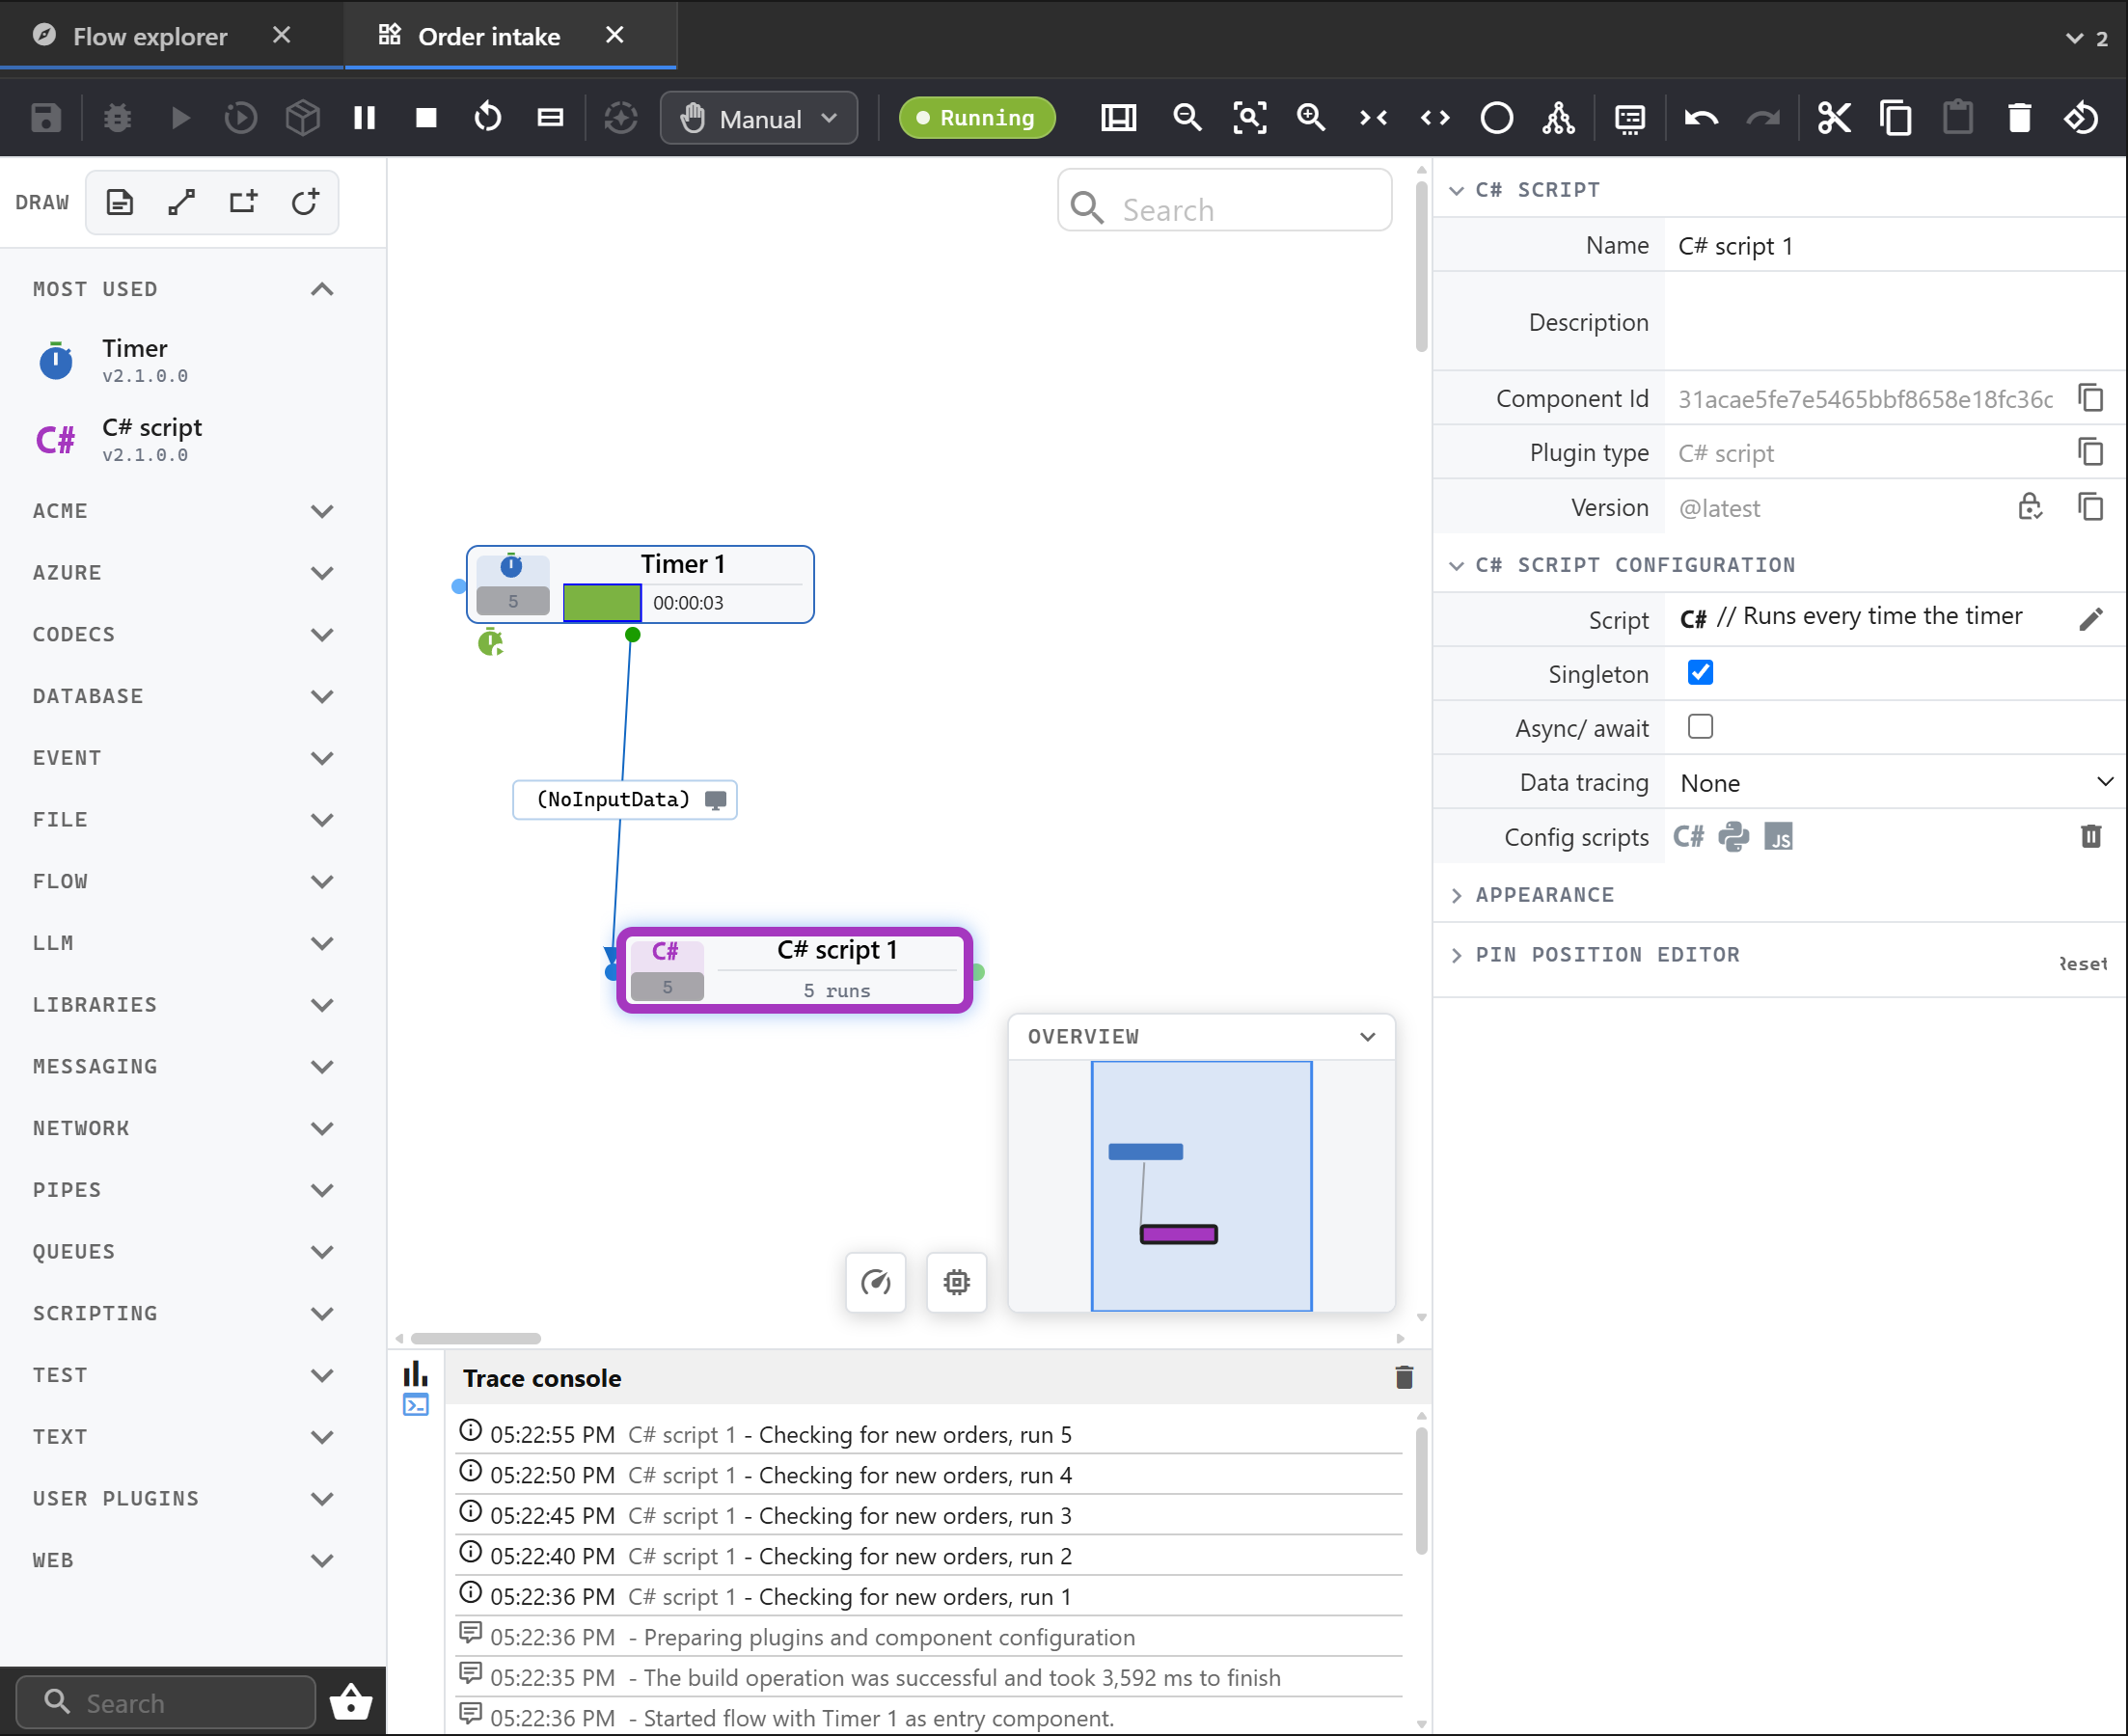
Press F5, or click Start in the toolbar. The flow compiles and starts, and the status changes to Running. Every five seconds:
- the trace console at the bottom shows
Checking for new orders, run 1,run 2, ..., - the C# script shows
3 runs,4 runs, ... on the canvas, - both components count their calls.
5. Look inside
Click the chart icon at the left of the messages pane to switch to the Runtime stats: calls, records and timing for each component.
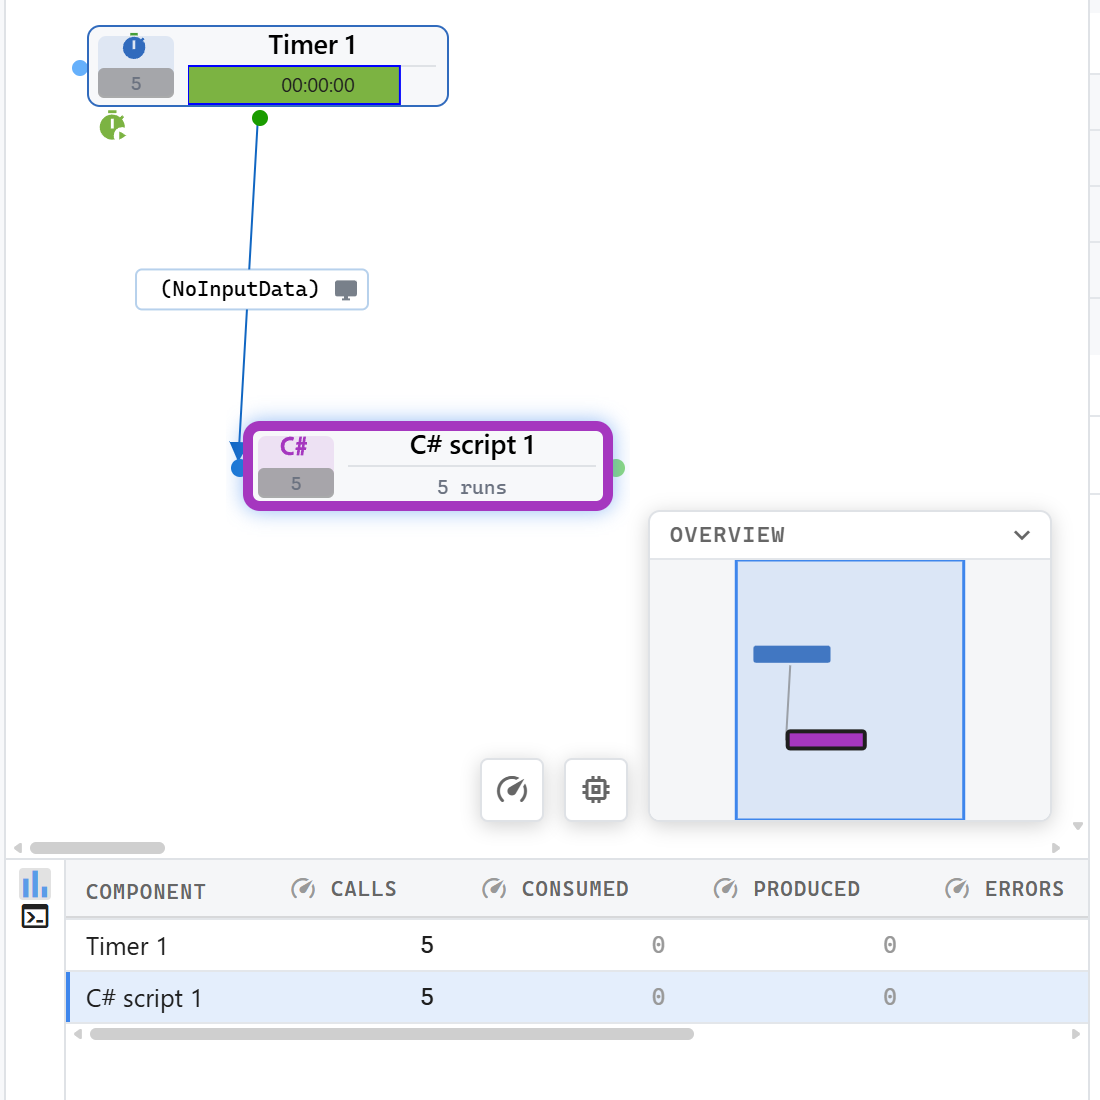
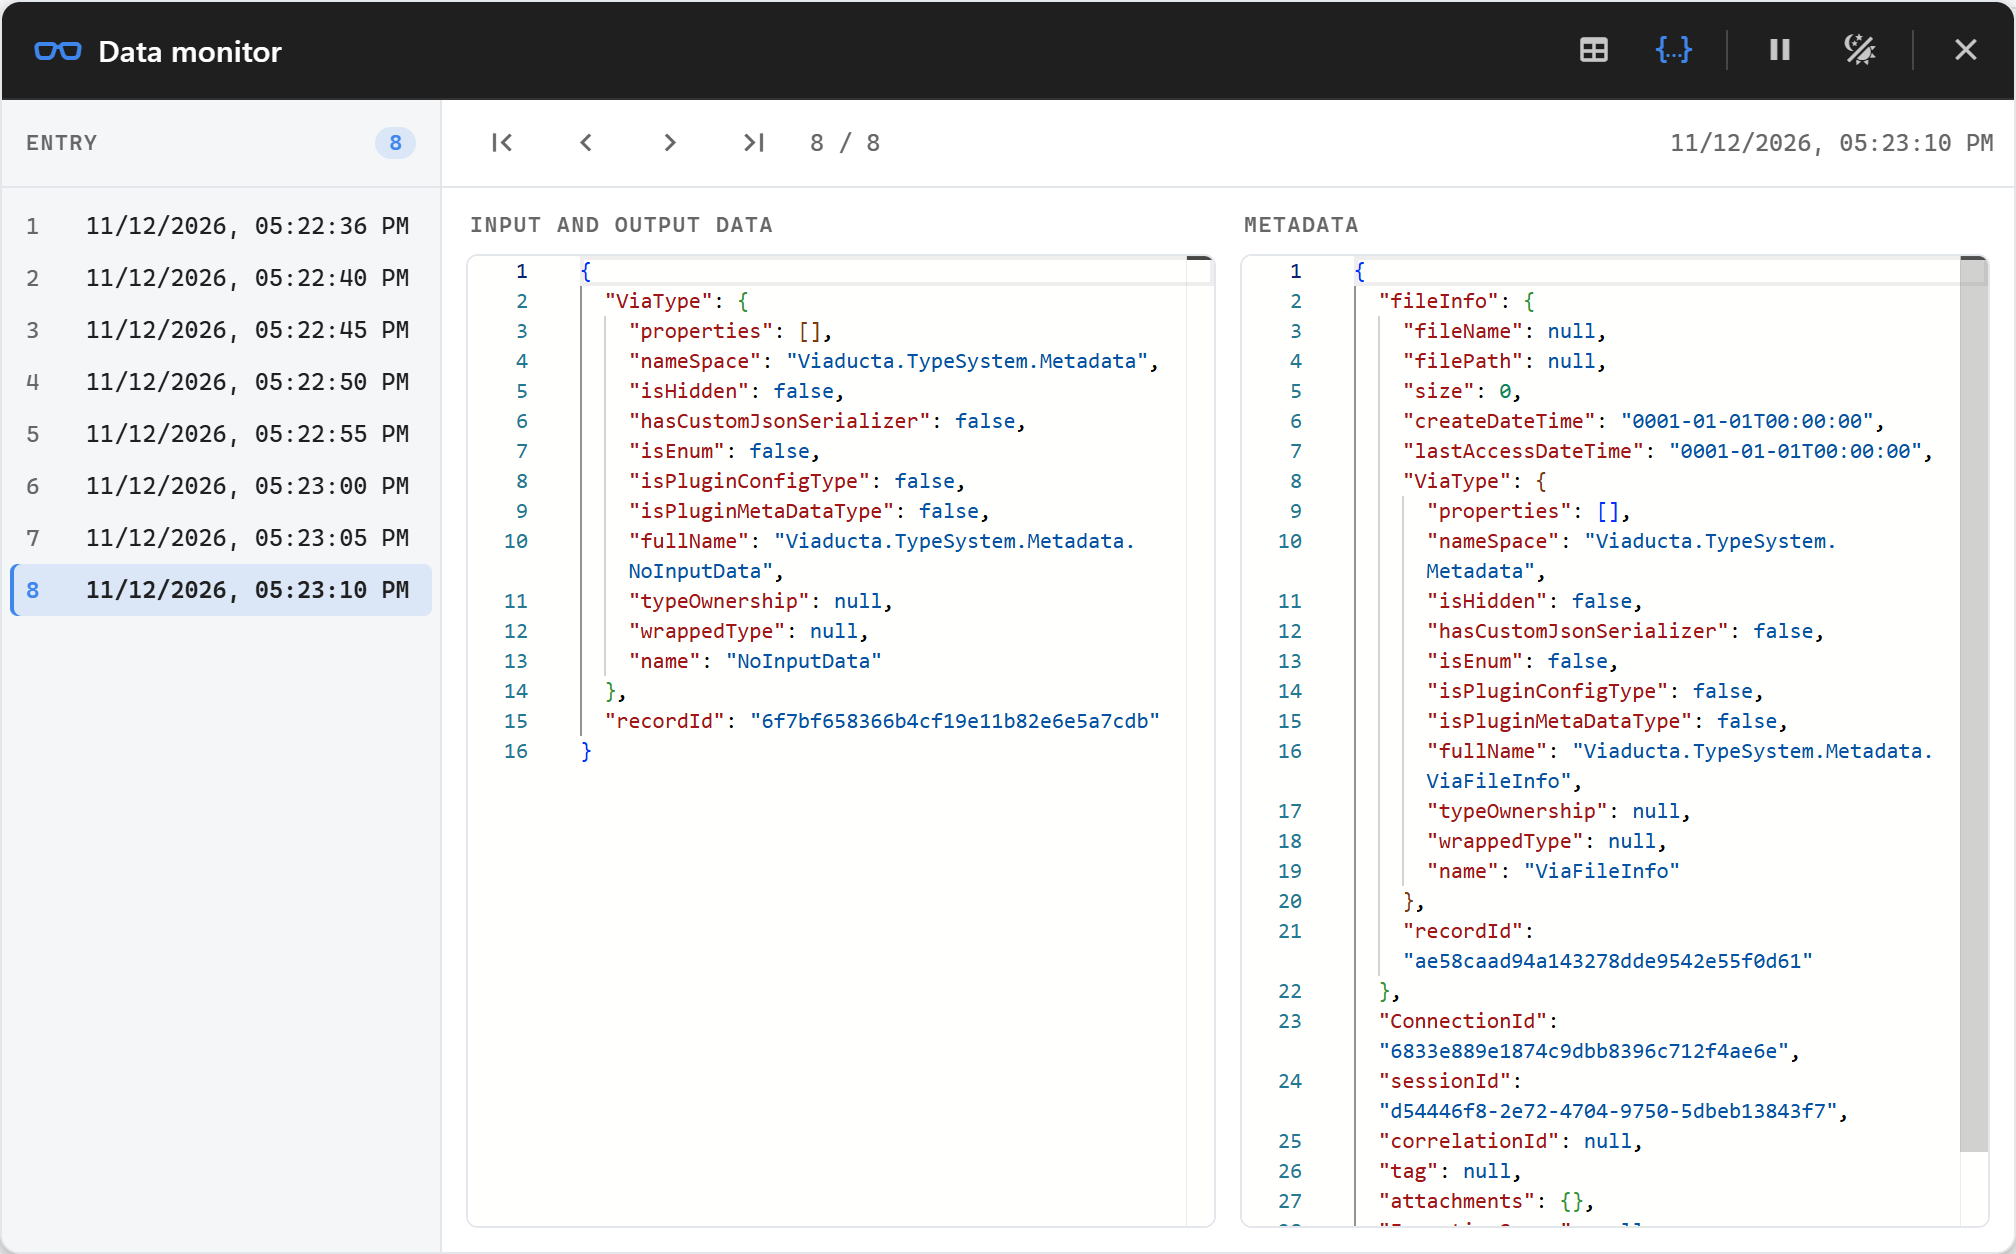
Click the monitor icon on the connection between the Timer and the script. The data monitor shows the records that passed the connection, with their metadata.
The Environment explorer in the left rail lists the flow with its host, state and up time.
6. Stop it
Press Shift+F5, or click Stop in the toolbar.
Next steps
- Receive orders from a web shop and post them to an ERP: Receive a webhook.
- Replace the Timer with an Http listener to start the flow from a web request, or a database plugin to read records. Browse all plugins.
- Give the connections types so the script works with real records.
- Learn the designer in Build a flow and Run and debug.
- Write more in C#, Python or JavaScript: Scripting.