Appearance
Run and debug
Run a flow
The toolbar of the flow designer runs the flow in the selected environment:
| Button | Key | What it does |
|---|---|---|
| Compile | F6 | Saves and compiles the flow, and lists any errors |
| Start | F5 | Saves, compiles and starts the flow |
| Debug | Ctrl+F5 | Starts the flow with the debugger attached |
| Pause | Pauses a running flow | |
| Stop | Shift+F5 | Stops the flow and unloads it |
| Restart | Ctrl+R | Saves, recompiles and restarts the flow |
| Logs | Opens the log viewer filtered on this flow |
The status next to the start mode shows the flow's state: Compiling, Compiled, Running, Paused, Stopped, Failed (it didn't compile) or Error.
You also start and stop flows from the Flow explorer, the Repository browser and the Environment explorer, one by one or a whole folder at once.
Follow a running flow
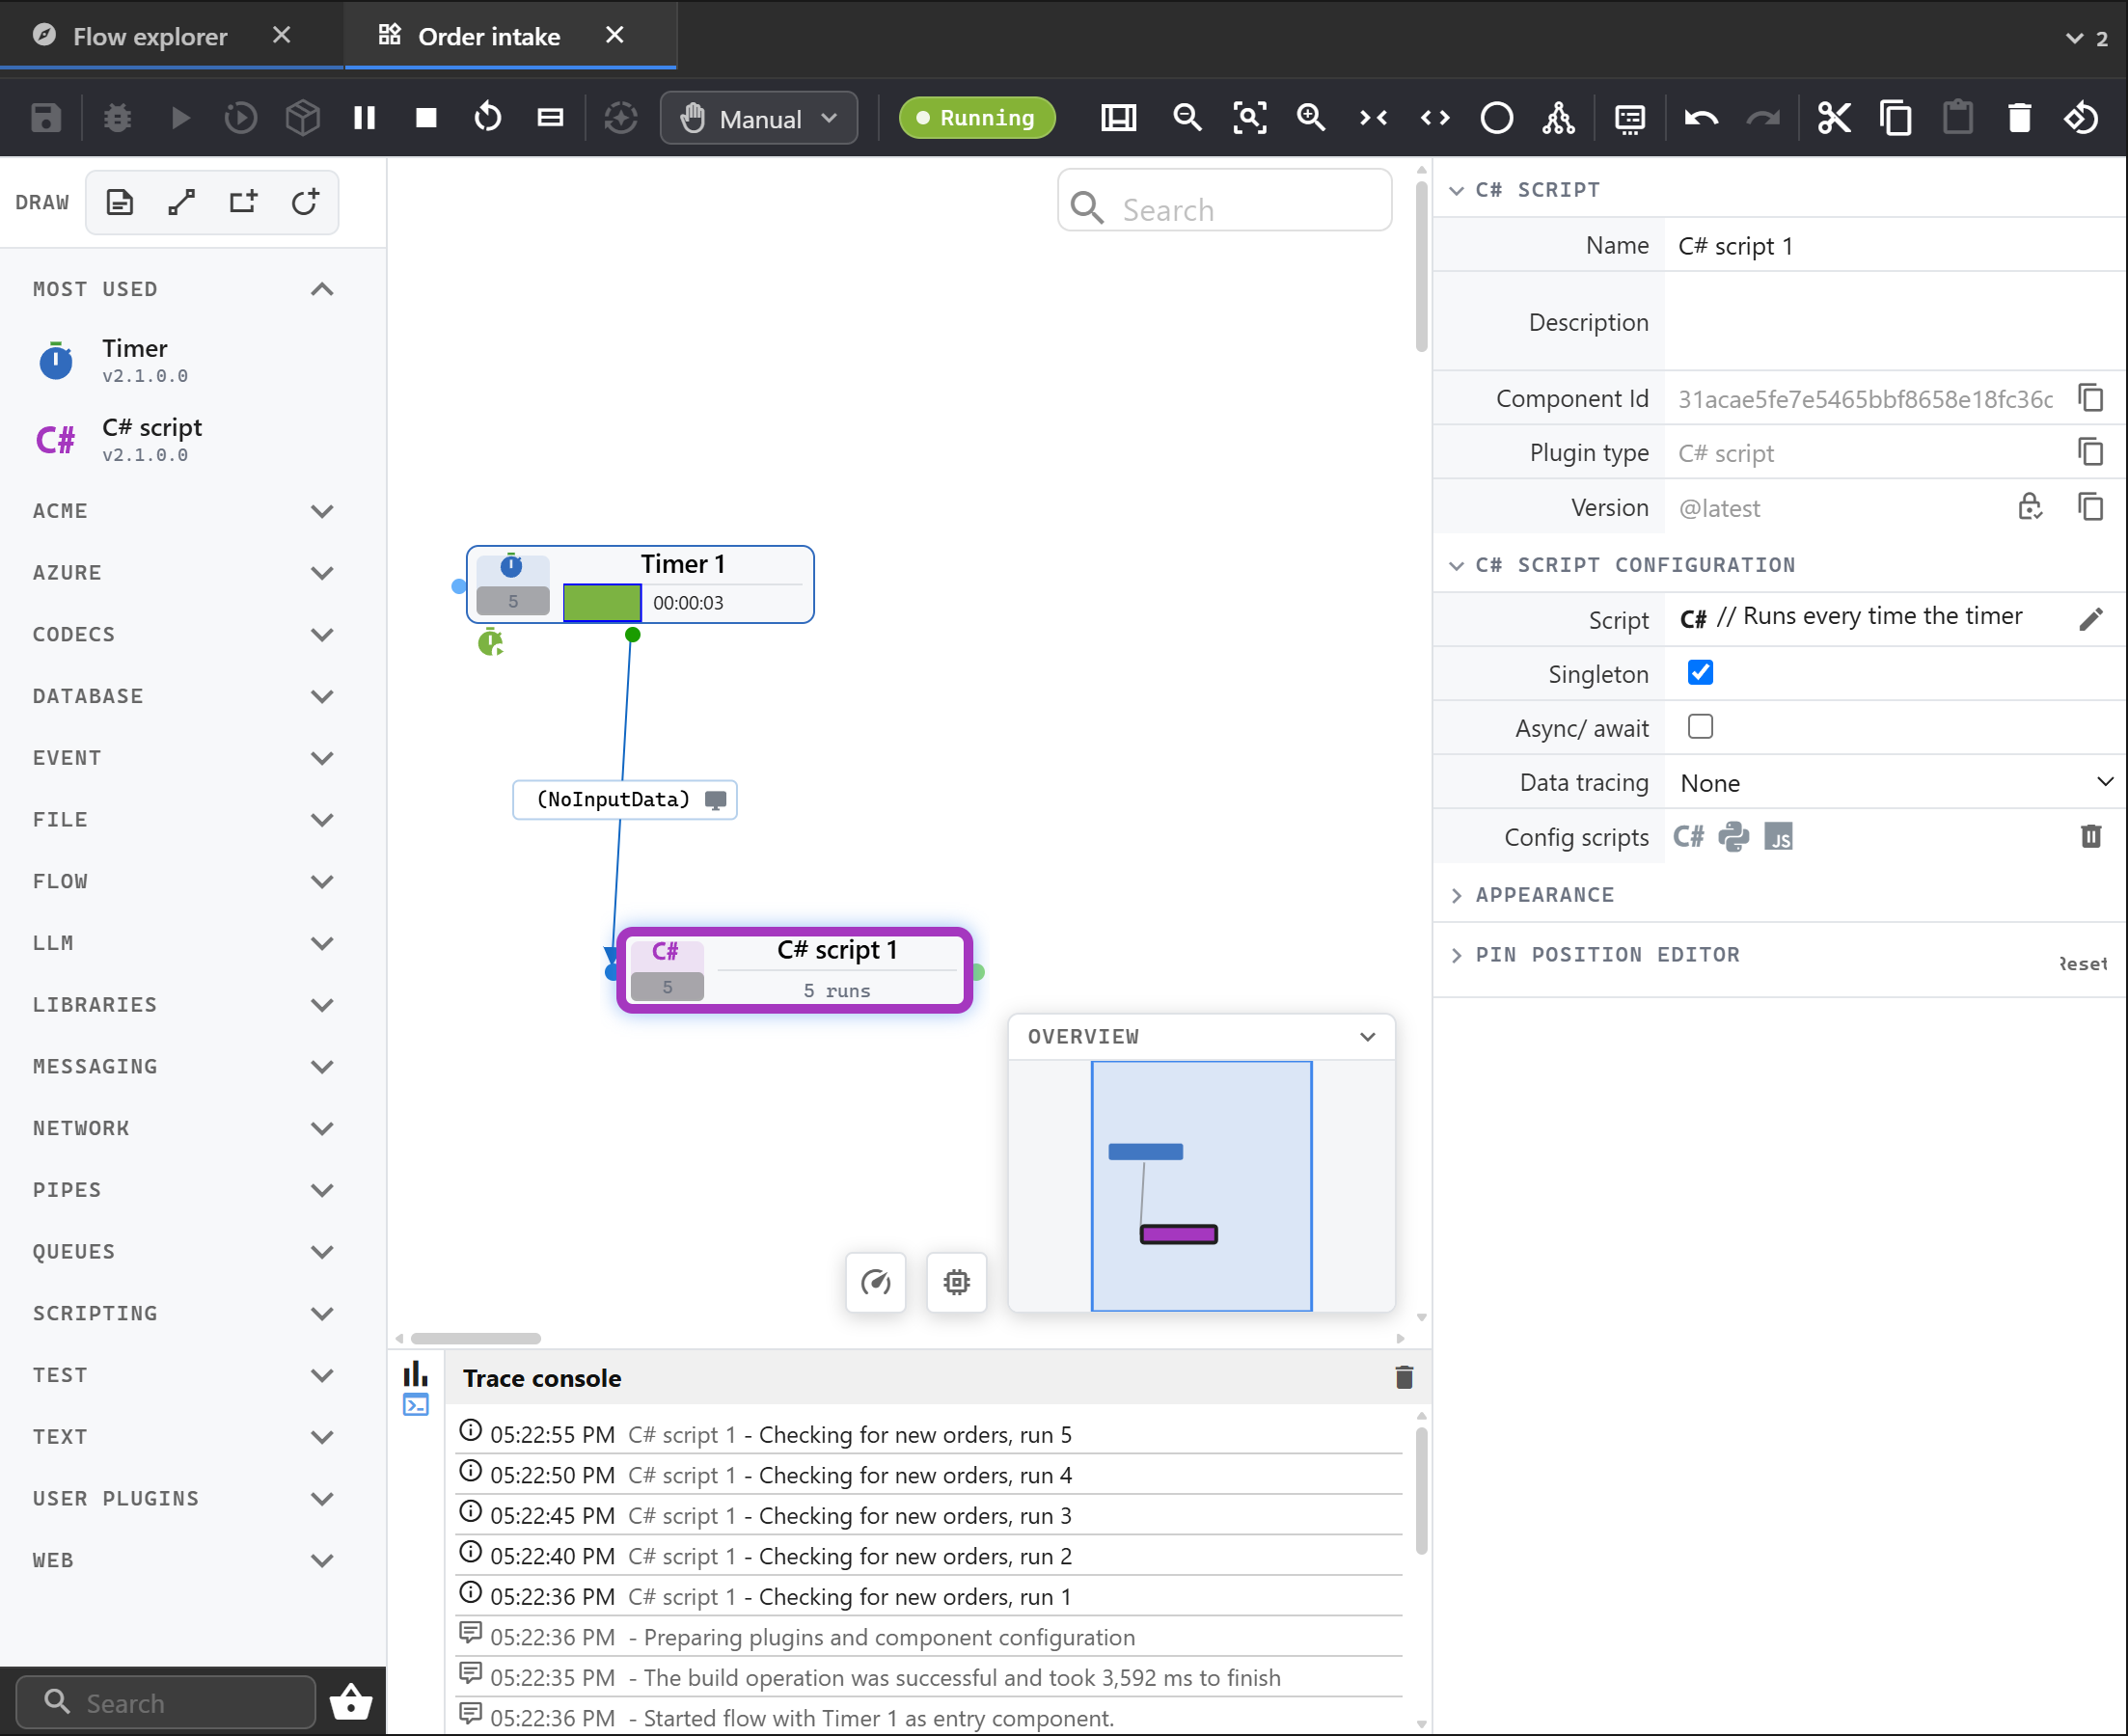
While the flow runs, the canvas shows what happens:
- each component counts its calls; the count turns red when there are errors,
- components that report progress show a progress bar or ring,
- the resource card shows the host's memory and CPU and the flow's up time.
Switch on the load view (the speedometer button) to make busy components glow by their share of the work. Slow components glow red.
Trace console
The trace console at the bottom shows the flow's messages, newest first: component messages, script output and errors. Click the component name to jump to it, or straight to the script line that wrote the message. On an error, Ask the AI about this error has the assistant analyse or fix it.
Runtime stats
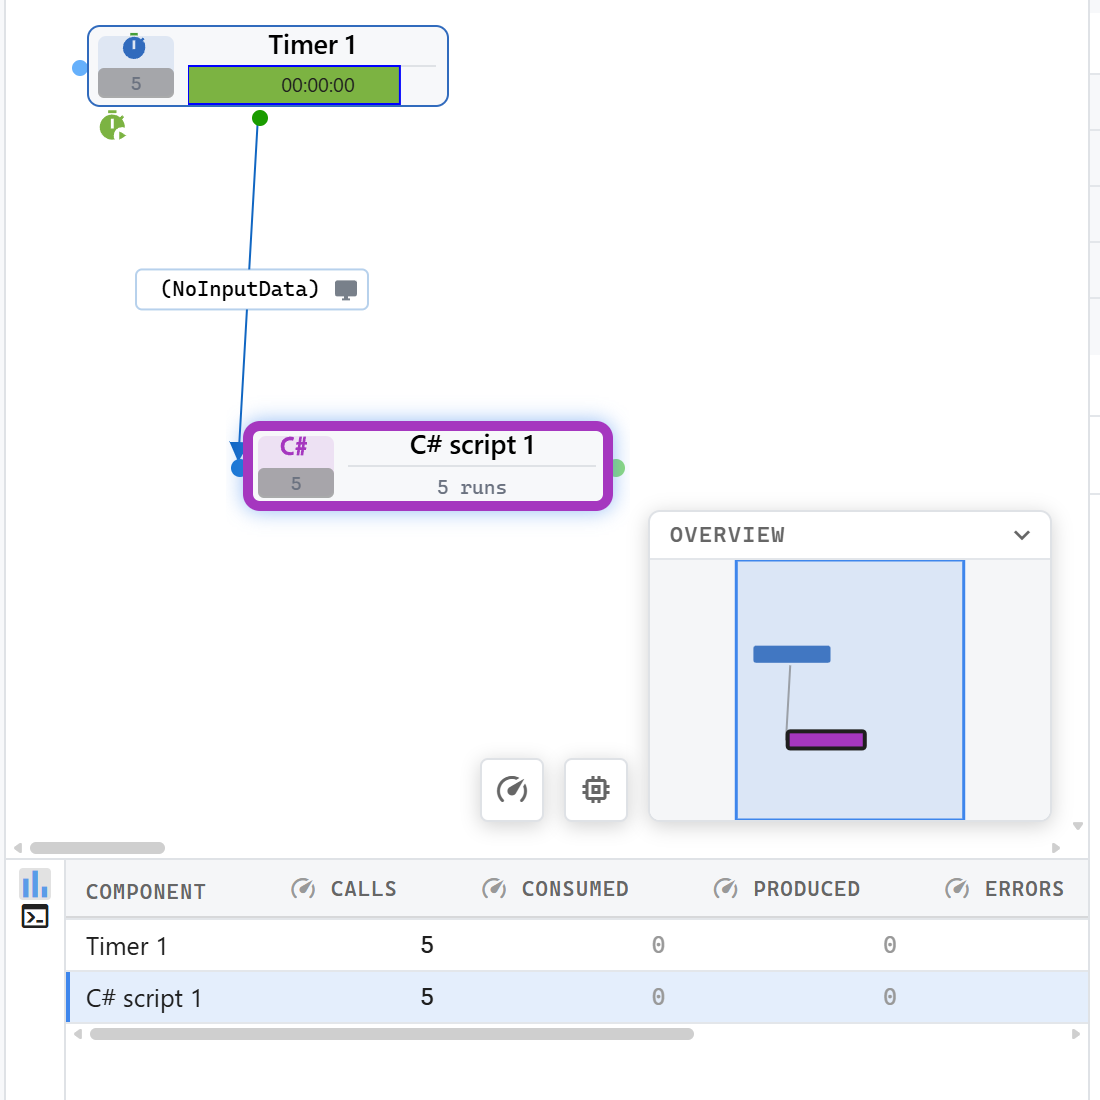
The Runtime stats console, next to the trace console, has one row per component: calls, records consumed and produced, errors, total duration, average per call and rate. Sort by any column to find the bottleneck. Click the speedometer on a column header to show that column as the load on the canvas.
The stats come from the profiler, which you switch off with Enable profiler in the flow configuration.
Data monitor
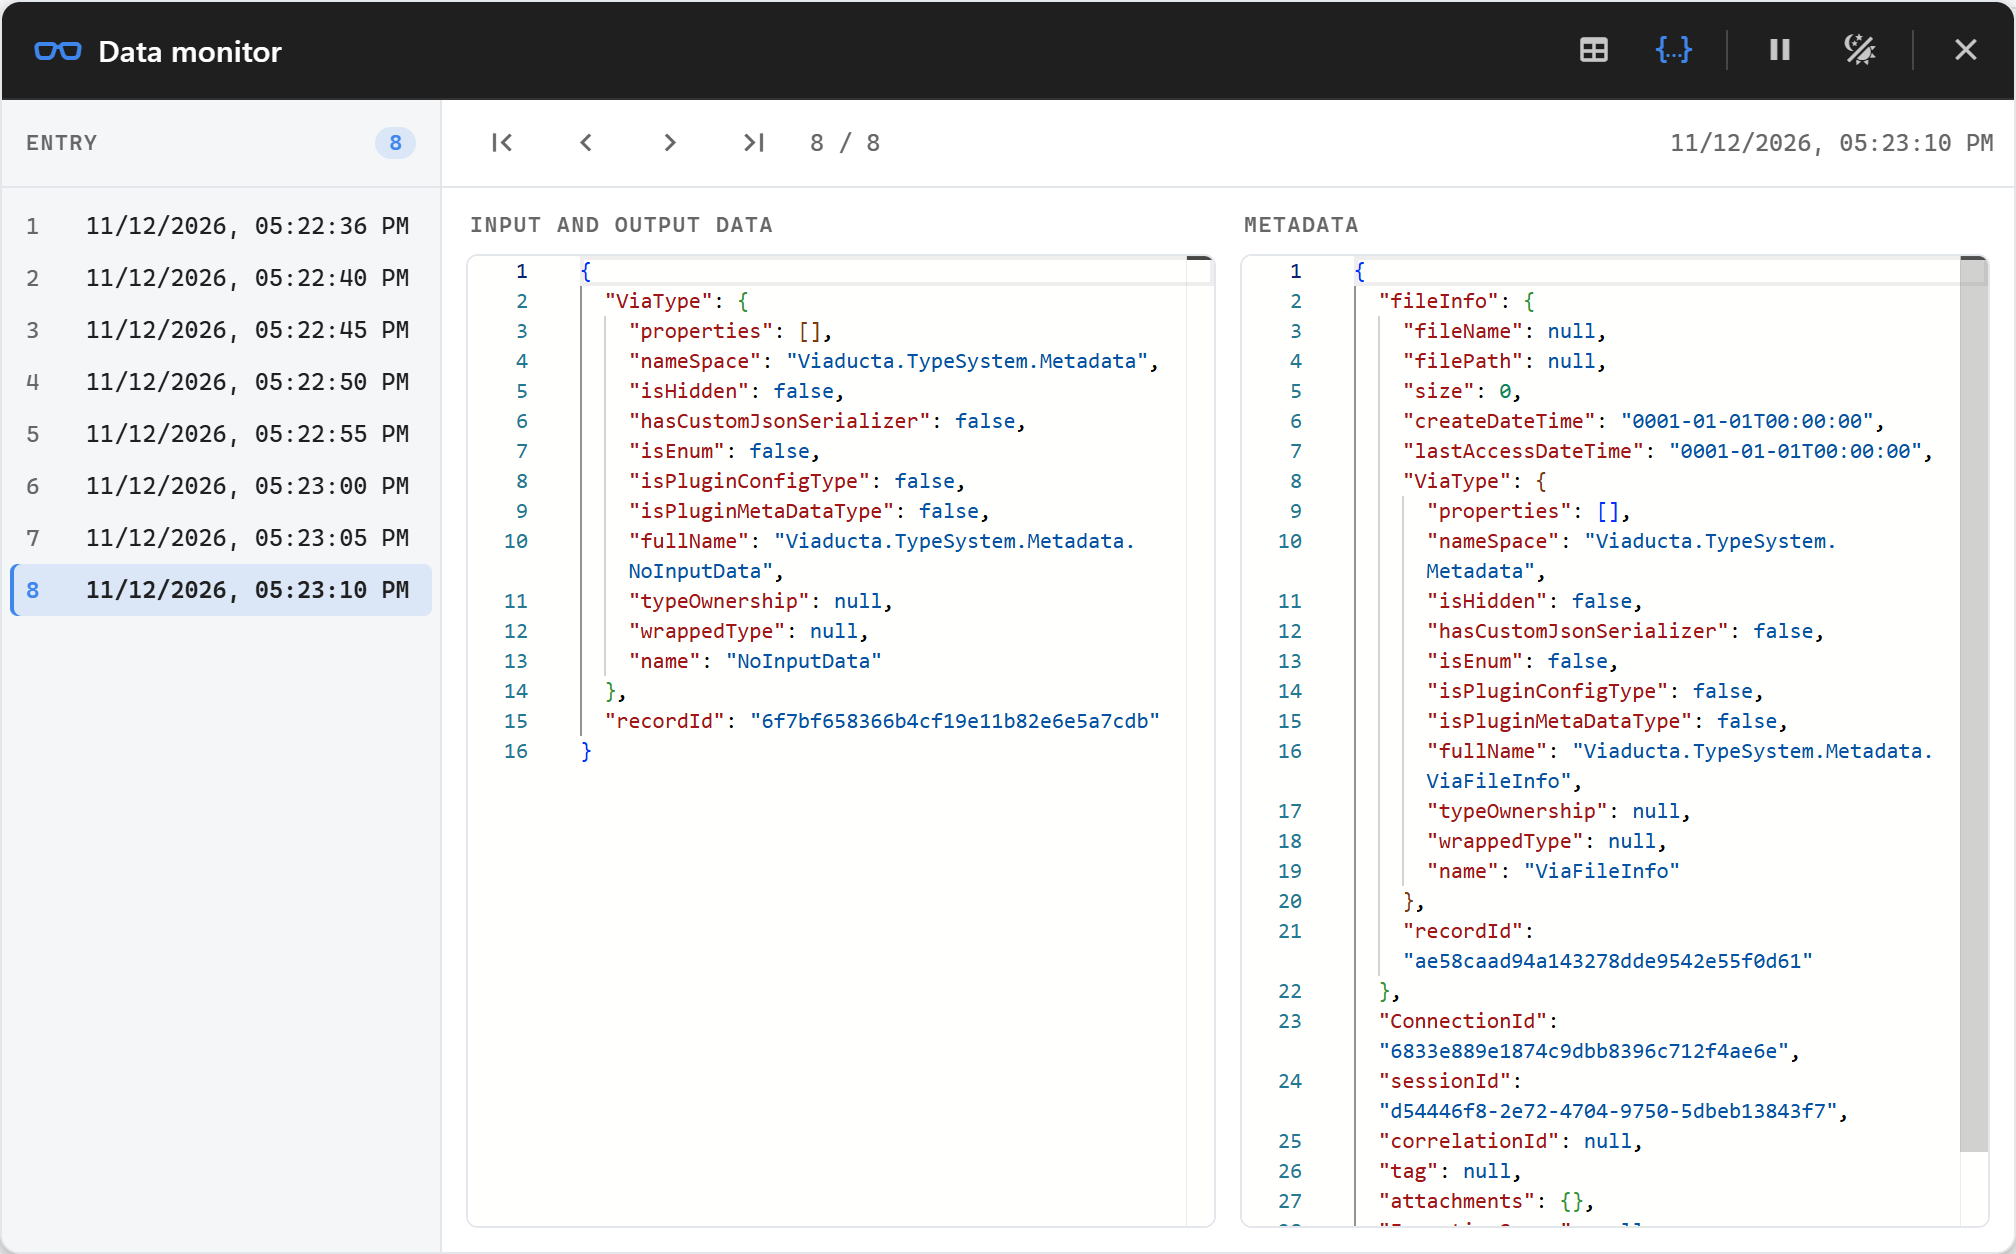
The data monitor shows the records that pass a connection while the flow runs, with their metadata.
Open it with the monitor icon on a connection, by right-clicking a connection, or by right-clicking a component and picking one of its connections. Browse the entries one by one, as a table or as JSON. Pause stops updates while you read.
The monitor keeps the last 25 records per connection. Switch it off with Enable data monitor in the flow configuration.
Debug
Start the flow with Debug (Ctrl+F5). The flow compiles in debug mode and stops wherever you set a breakpoint.
- On a component: select its input pin to stop when a record arrives, or its output pin to stop when the component is done, and click Sets the breakpoint in the pin properties.
- In a script: click the margin next to a line in the script editor. Breakpoints you set while the flow is stopped are sent when you debug it.
When the flow stops, the watch window shows the variables, the record and its metadata. Expand objects to see their fields; the glasses icon opens the data monitor on the paused record.
| Key | Action |
|---|---|
| F5 | Continue to the next breakpoint |
| F10 | Step over |
| F11 | Step into |
| Shift+F11 | Step out |
| Ctrl+F9 | Remove all breakpoints |
In debug mode an error in a component stops in the debugger instead of going to the flow's error handling.