Appearance
Build a flow
Create a flow
Click New logical flow in the Flow explorer, or Add logical flow on a folder in the Repository browser. The flow is created with a default name and opens straight away. Rename it in the flow properties: click an empty part of the canvas and change Name.
Ctrl+S saves. Saving checks the flow first and lists any problems in the messages pane; Compile, Start and Debug save for you.
The flow designer
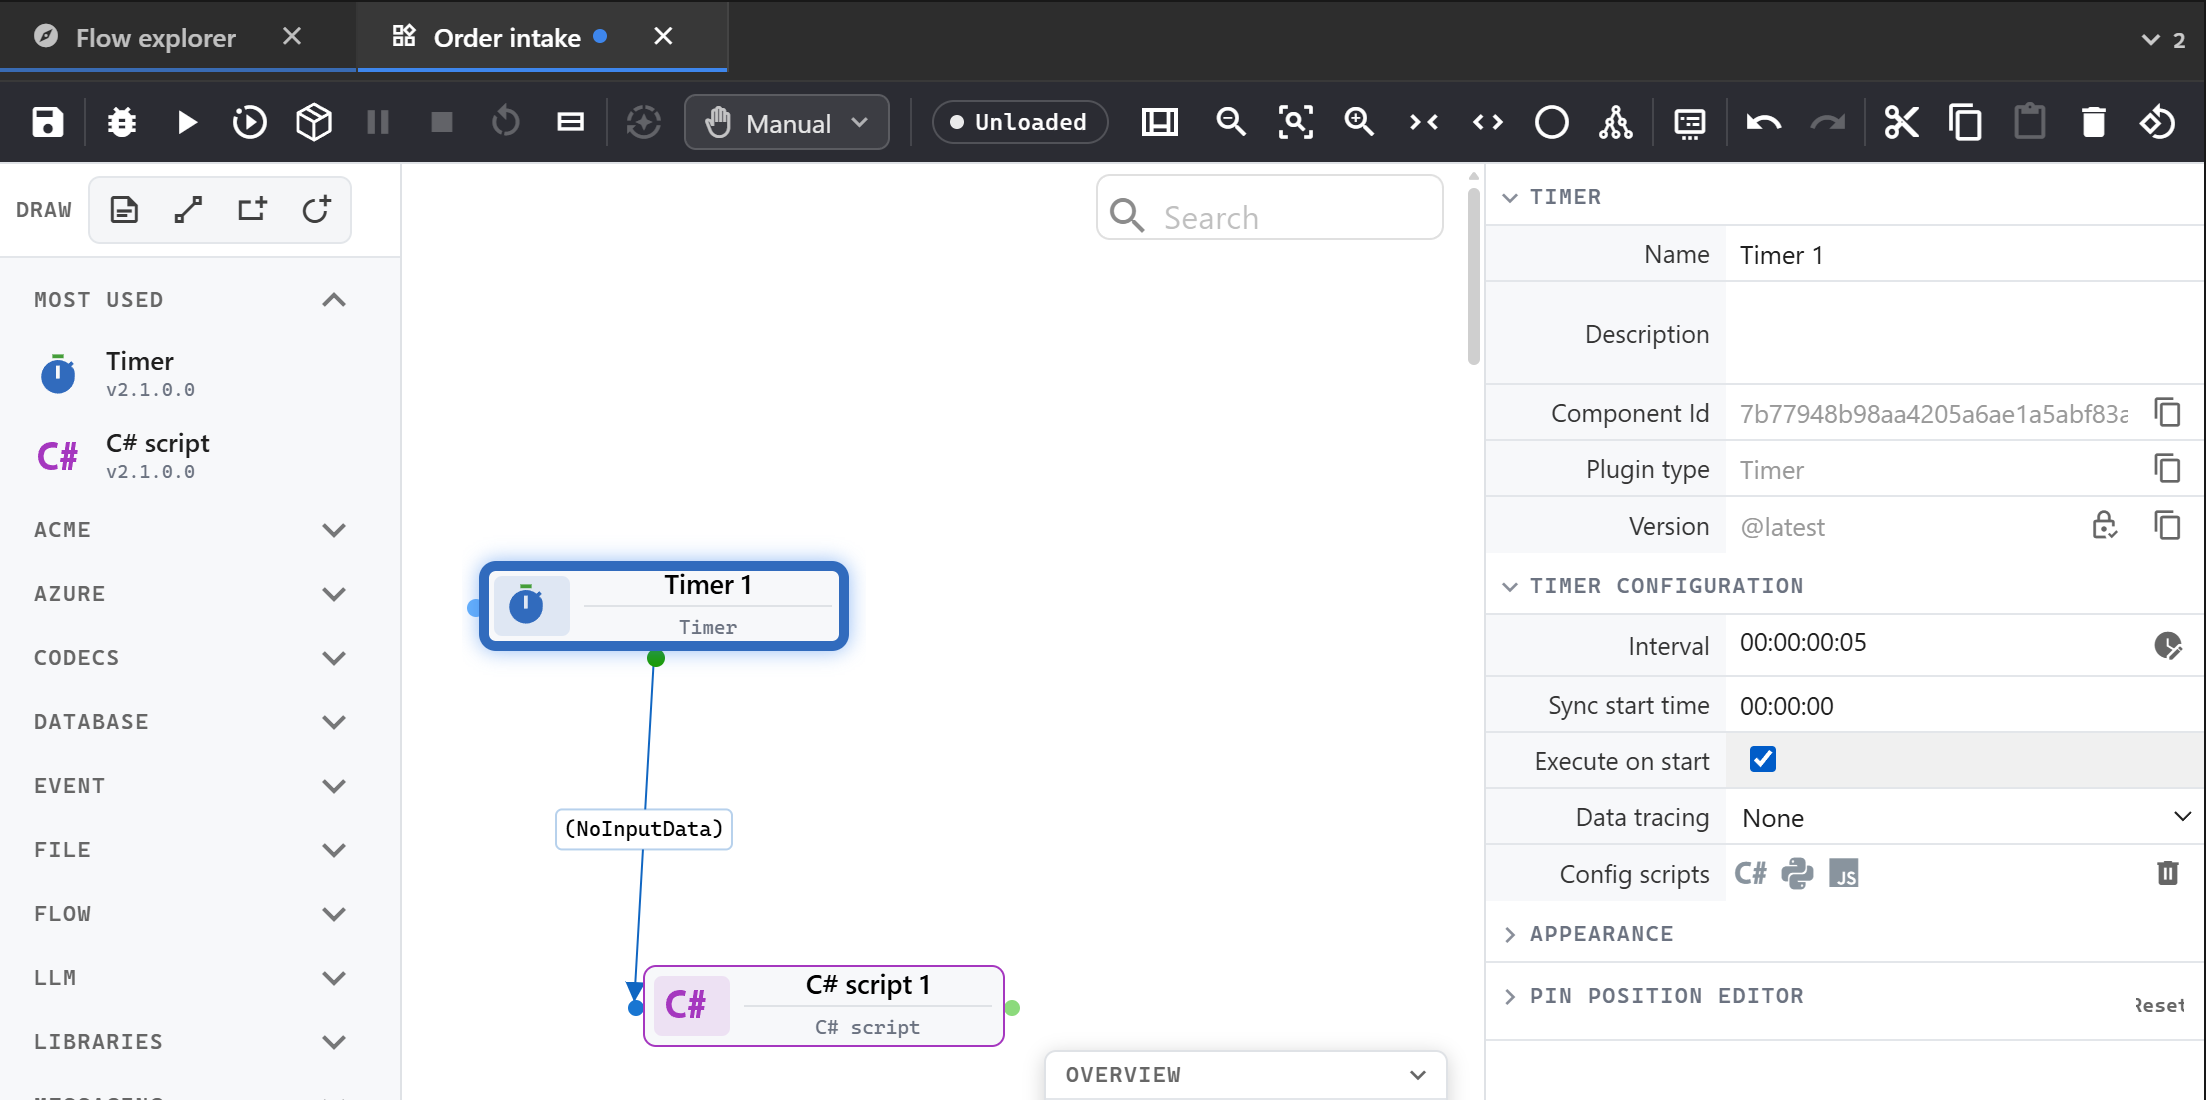
The canvas sits between three panels: the toolbox on the left, the messages at the bottom and the properties on the right. Switch panels on and off with the Designer layout button, or cycle the layouts with F4. Drag the borders to resize them.
Place components
The toolbox lists the plugins by category, with Most used and your Favorites first. Hover a plugin to read what it does; star it to add it to Favorites. Type in the search box at the bottom to find a plugin by what it does.
Drag a plugin onto the canvas, or click a search result to place it in the next free spot.
Connect components
Press on an output pin and drag to an input pin. The designer only lets you connect pins whose types fit.
- Drop on empty canvas to pick the next plugin from a menu: it is placed there and connected.
- Ctrl+drag from a pin to have the designer suggest the next plugin.
- Shift+drag a pin to move it along the component's edge.
Select a connection to set its properties:
| Property | What it is |
|---|---|
| Data type | The type of the records on this connection. Search… finds a type; New type opens the type editor. |
| Route Id | The branch name for a Decision router |
| Connection type | Straight, curved or stepped line |
| Show route, Show type | Show the route id or the type on the canvas |
Double-click a connection to open its type in the type editor. While the flow runs, right-click it to open the data monitor.
Set component properties
Select a component to see its properties. Hover the component's name at the top of the panel to read its description. Below it:
- Name and Description,
- Version, with a lock to stay on this plugin version or always use the latest,
- the plugin's configuration, one row per field, with an editor that fits the field: text, choices, code, SQL, schedules, mappings, database objects,
- Config scripts, the pre-execution scripts,
- Appearance and the pin positions.
Type = in a text or number field to use an expression setting or open the expression builder. Double-click a component to open its main editor, such as the script or the SQL.
Select a pin to see its types and set a breakpoint.
Arrange the canvas
- Auto arrange lays the flow out top to bottom, left to right, in the smallest area or wrapped to fit the view. Tidy keeps your layout and only fixes overlaps.
- Collapse and Expand make components narrow or wide; the shape button draws them as circles or rectangles.
- Zoom in, Zoom out and Reset zoom are in the toolbar. The Overview in the corner shows the whole flow; click it to jump there.
- The search box on the canvas finds a component by name, configuration or script.
Click to select, Ctrl+click to add to the selection, or drag a rectangle on the empty canvas. Undo, redo, cut, copy, paste, delete and rotate are in the toolbar.
Add notes
The Draw row of the toolbox has an Annotation for formatted notes, and lines, rectangles and circles to group parts of the flow visually. Choose Behind or In front to layer them with the components.
Flow properties
Click an empty part of the canvas to see the flow's properties.
| Property | What it does |
|---|---|
| Name, Namespace, Description | How the flow is named, and the namespace of its code |
| Hosting type | Shared host, Private host or Tag based; see hosting strategies |
| Hosting tag | The tags for tag-based hosting |
| References | NuGet packages for C# and pip packages for Python |
| Flow configuration | Profiler, data monitor, parallelism, log level, plugin updates, data tracing |
| Test flow, Specification | The flow's test flow and specification |
| Diagram | Component shape and canvas size |
The flow configuration fields:
| Field | Default | What it does |
|---|---|---|
| Enable profiler | on | Collects the runtime stats |
| Enable data monitor | on | Lets you watch the data on connections |
| MDP | 99 | Maximum number of records processed in parallel |
| Log level | Verbose | The lowest level written to the log |
| Use latest plugins | on | Runs the latest version of each plugin |
| Keep alive | off | Keeps the flow running when it has nothing to do |
| Data tracing | None | Logs records before, after or around each component |
Start mode
The start mode in the toolbar decides when the flow runs:
| Mode | The flow starts |
|---|---|
| Manual | Only when someone starts it |
| Auto | Every time the controller starts |
| Disabled | Never, not even by hand |
For an Auto flow, Modify auto start dependencies picks the flows that must be running first.